Design meets Controlling

The integration of BI tools has revolutionized the world of numbers in companies. The introduction of BI tools such as Tableau and Co. poses major challenges for the management, IT and controlling departments. At the same time, this change in processes means automation, optimization and better control elements for management.
I worked for two years on projects in the context of the integration of BI tools from a financial and controlling perspective. It is currently my goal to write two scientific papers to understand the IT world of BI tools.
But today I would like to write about a different perspective that I have enjoyed in my work, the creation of dashboards. In order to create dashboards well, it is not only important to be able to use the programming language quickly, but also to meet management requirements and the use of design.
My specialization in dashboards enabled me to present my work better and to build up my USP.

Here are my tips for creating dashboards:
1. The Statement
Before you even start, think about who you want to build this dashboard for. What are the goals of your target group? Min your KPIs.
2. Representation
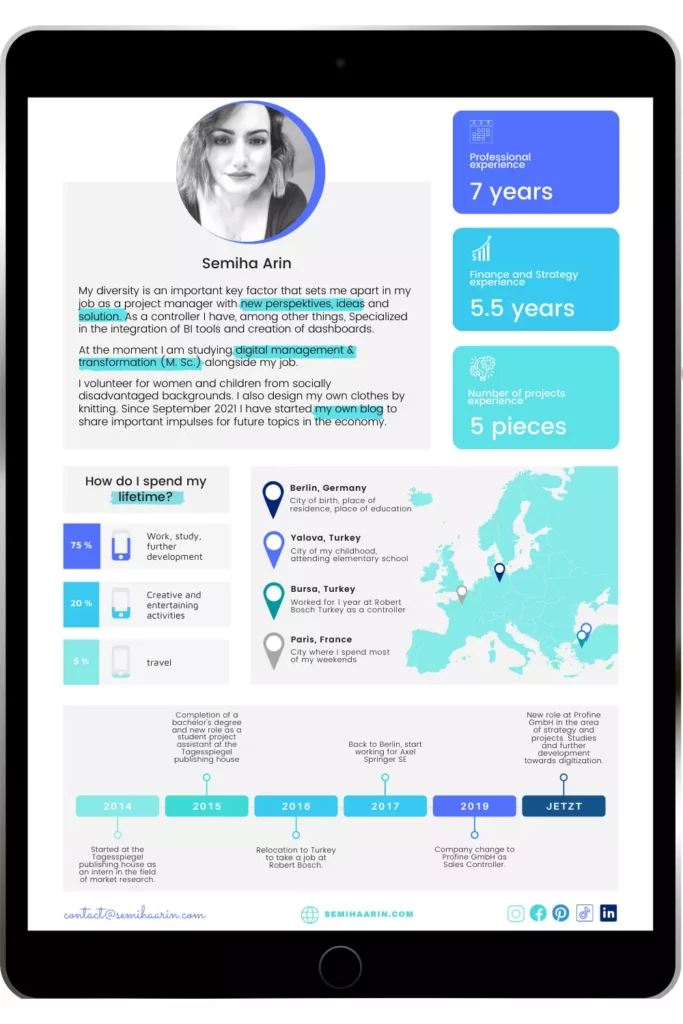
I would always recommend highlighting 3 KPIs. Show the rest as diagrams or as Smart Art (max. 5-7 pieces).
Tip: When you have set your KPIs, do some research on the Internet and get inspiration.
3. Design
We have to orientate ourselves towards the customer, that means always according to the corporate design or the style of the management.
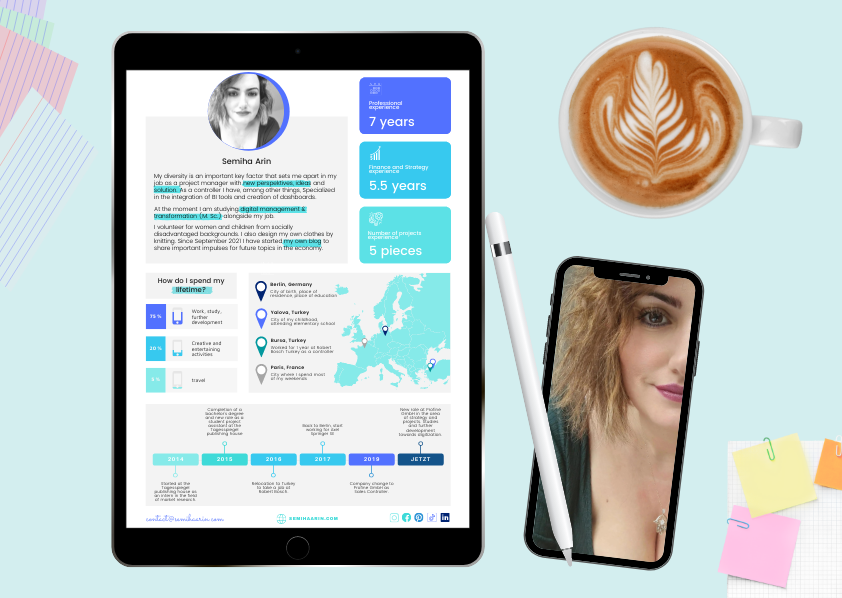
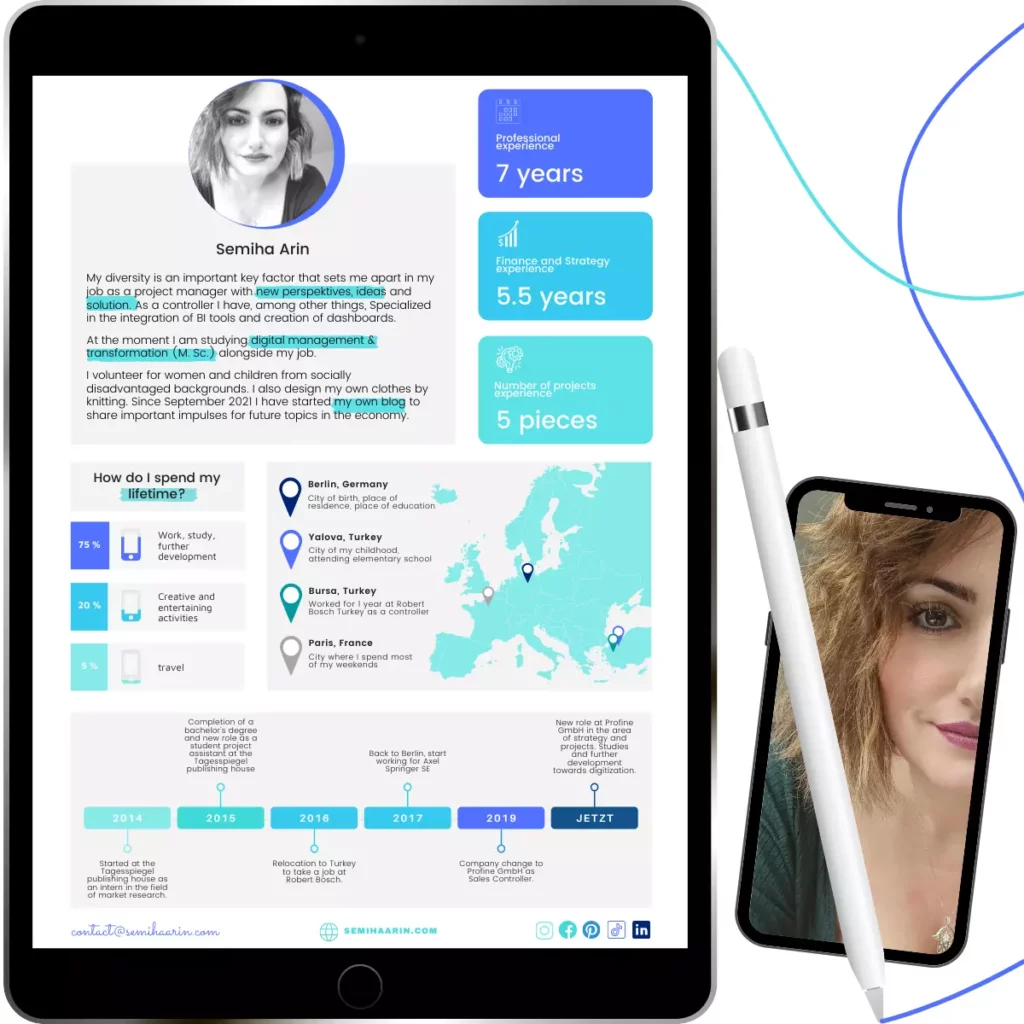
a) I recommend choosing light gray or white for the background. For example, you can highlight the background of your diagrams with gray. As you can see from my example, the box form in the background gives a clear structure to the eye.
b) Colorful colors should not be more than 3 different. Most companies have blue in their corporate design (blue always means trust). Blue has a very calming effect on dashboards. That’s why I recommend it.
c) Font should be one, you can use light and bold versions.

Tip: In general, it is important to make dashboard pages “clean”. The content should automatically answer important questions.


